Not so well according to a recent study [1]:

Thought the study seems to present numerous flaws, starting by a lack of common metric to measure the service regularity accross different systems, it tends to comfort some conlusion we have drawn previously in regard of the skytrain system reliability[1].
The study presents this interesting matrice showing the service reliability as a function of the frequency.
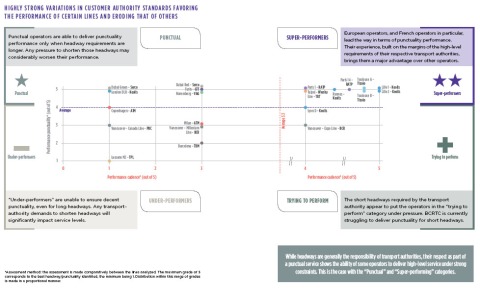
…and highlight the fact that a very high frequency system (The Paris subway line 14 has a frequency of one train every ~85s, while the Lille subway has a frequency of one train every ~60s.), requires a very reliable system, something Vancouver could apparently not be able to achieve with its current system [3].
Others metric of interest


[1] wavestone: 2017 World Best driverlss metro lines, 2017
[2] >Some questions on a skytrain meltdown, July 23, 2014
[3] We have already touched some words on the frequency issue, in our subway capacity post, and the great variance in dwelling time observed on the Vancouver network could negatively affect the network reliability.
Vancouver snow response: when ideology trumps reality
February 10, 2017


The pictures above could not all refers to the same snow fall day, but every snow day convey the same story: A transit meltdown when the city seems to not spare any energy to clear the bikeway network.
The biais has been noticed by several media outlet, and seems encouraged by some which could have some influence on the city hall culture:
albeit, some city staffs seem to want to make sure no tax dollars are spared toward the well being of cyclists:
It is possible that local advocates misinterpret how the things are done in Copenhagen, where the bike lanes use to be along the city’s arterials:

The city of Vancouver explains it has 14 “priority” route: in fact, it has 14 route, period: one of them looks like:

Only ~50% of this route cover either a truck route or a frequent transit network route. and the crux of the underwhelming Vancouver snow response lies here: there is virtually no route priotization which leads to high inefficienies in the way snow removal equipment are deployed.

~200km of high priority route to clear in the city limits, covering the Frequent Transit Netwrok, major truck routes, main hospital accesses, and the municipal “Disaster response routes“
the above map covers the frequent transit network, major truck route, hospital access, and the municipal “Disaster response” routes in the city limits: that represents ~200km of streets: 14 snow plowers can clear this entire network, one lane/direction, in ~1 hour (assuming a ~30km/h snow plow average speed): On friday, February 3rd, the total snow accumulation was ~12cm, falling at a rate of less than ~1cm/hr on average, and still the city let much more than 5cm of snow to accumulate on the main arterials such as Granville where the transit service was halted several time during the day…same on 41st and 49th avenue to speak only of few I have been made aware, not discounting the bus 20 was still not able to make south of 54th on February 8th. A similar transit meltdown occured on Monday 6th, total snow precipitation for the day: 7cm!
another problem could be due to the deployment procedure of the snow plowing equipments: plowing takes place if there is more than 5cm of snow accumulation. The 5cm trigger is the same as in Toronto, however the level of water content in snow tend to be 50% higher on the west coast, so that the same level of snow precipitation leads to significantly more slushy condition in Vancouver than in Toronto [1]…. Also, Toronto deploys snow plowing equipment as soon as 2cm of snow accumulates on its expressway networks.
[1] this is extrapolated from USA data. for more information on the relative level of water content in snow, see Martin Baxter: Snow to liquid ratio, climatology and forecast methodologies, 2005
Post updated on January 29th, 2017
Ill conceived, since according to Translink [1], The proposed Surrey L line (Guilford, Surrey central newton, titled LRT 4 in the transit study), was among the poorest options Translink has studied for Surrey. An option which will saddle translink with increased operation cost without matching revenue to sustain it, for generation to come [1]. and an option which provide a deeply negative return on investment:

Even a multiple account evaluation (taking account social benefit at large), The return on investment is simply not there! (figure from [1])
Ill conceived because the Surrey LRT approach is in essence local and ignore the regional demand.
Missed opportunity because it will hinder the region to do the right thing to develop alternatives allowing the south Fraser area to become a less car dependent place before it is too late. At the root of this poor decision making is an original sin: A Vancouver centered optic where Surrey is seen as a fringe area in need to be connected to the Expo line; and a ideological bias from the Surrey City council making the streetcar the only answer whatever the question is. This optic ignore the development occurring in the Fraser valley, in Langley and beyond, more noticeably Abbotsford and Chilliwack, and the subsequent regional transportation demand; something we have touched in 2012:
Context and opportunities

A draft Regional transportation demand in the Fraser Valley
The region becoming more vast than Metro-Vancouver, people travel longer distance, with more dispersed destinations, the challenge is then to provide an appealing transit alternative for people in the Valley and the south Fraser area: that means, fast comfortable, and as few as possible transfer toward meaningful destinations.
A LRT running not faster than a bus is not a compelling solution on which to build a regional transportation backbone, but a transportation mode such as the skytrain is not suitable for long distance travel; Also the skytrain technology, designed for very frequent service, become too expensive to maintain as soon as less frequent service is needed [9], so extending the skytrain forever is not a solution able to address the need beyond Langley.
The Interurban vision
It is time for the Vancouver region to explore new paradigms, and reconsider the regional train with an European eye. That is to not entertain solution such as the West Coast Express, but to consider light passenger trains able to achieve a commercial speed in excess of 70km/h (typically means max speed in excess of 140km/h)[13], with comfortable seating: the bombardier Talent, once used for the Ottawa’s O train, is a good starting point to entertain the discussion. below is the kind of rolling stock we have in mind:
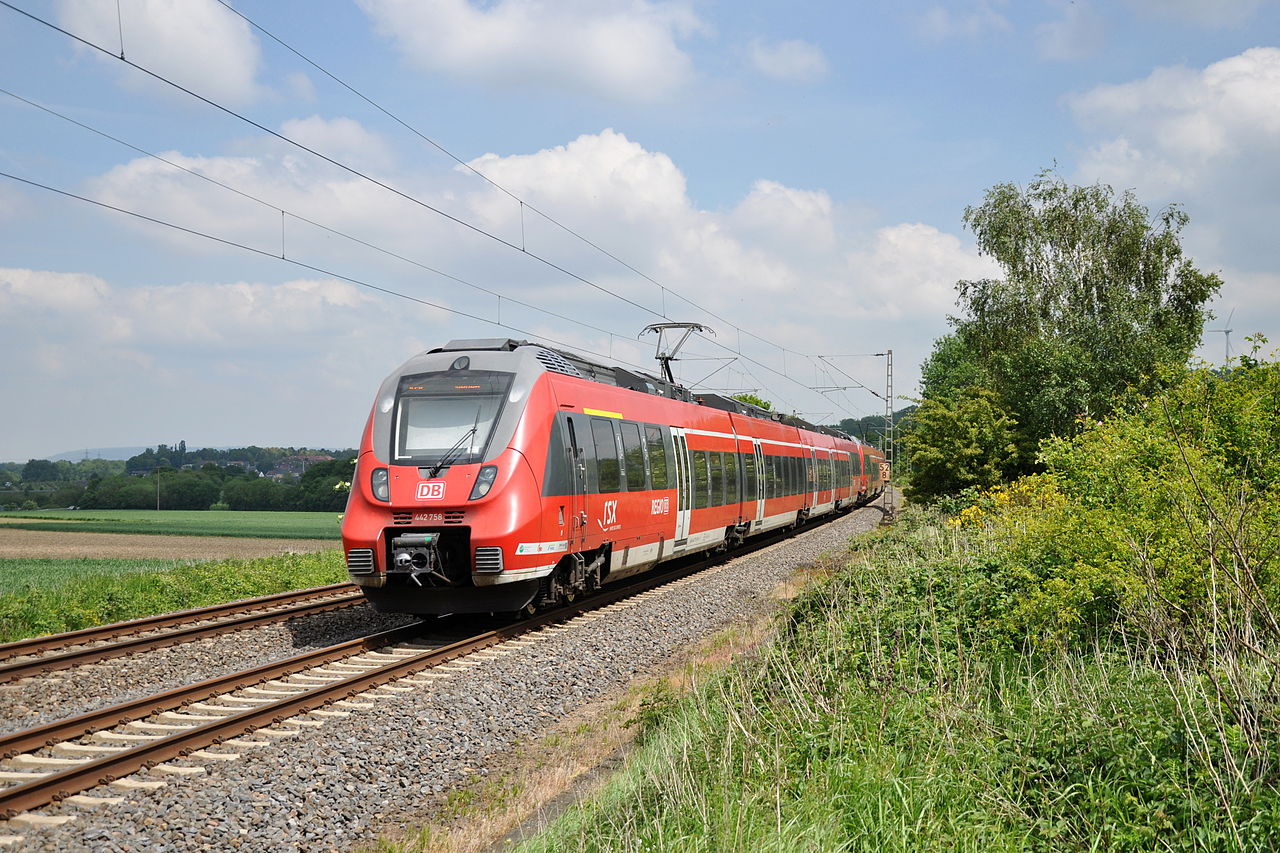

Bomabrdier Talent 2, able to run at up to 160km/h and a Alstom Regiolis tram-train, able to run at 100km/h on mainline, and still able to run as a tram on the street (credit wikipedia)
Thought the Fraser valley has the former interurban line, the BCER, this line is not suitable for most of its length: it presents a too meandering horizontal alignment. It is also already heavily used by freight trains in some sections[3], while in other, the tracks need to be completely renewed in order to accommodate off the shelve European train set [17], so there is no clear value at constraining the option on the sole BCER corridor. Below is an example addressing the challenge, with a 70km long rail line (in blue) from Richmond Bridgeport to Abbotsford (connecting with the former BCER for potential extension to Chilliwack) using mainly BC Hydro corridor (and rail rail fo way in Richmond).Part of the line reflects also a vision once expressed by the White Rock Transportation and safety committee [12]
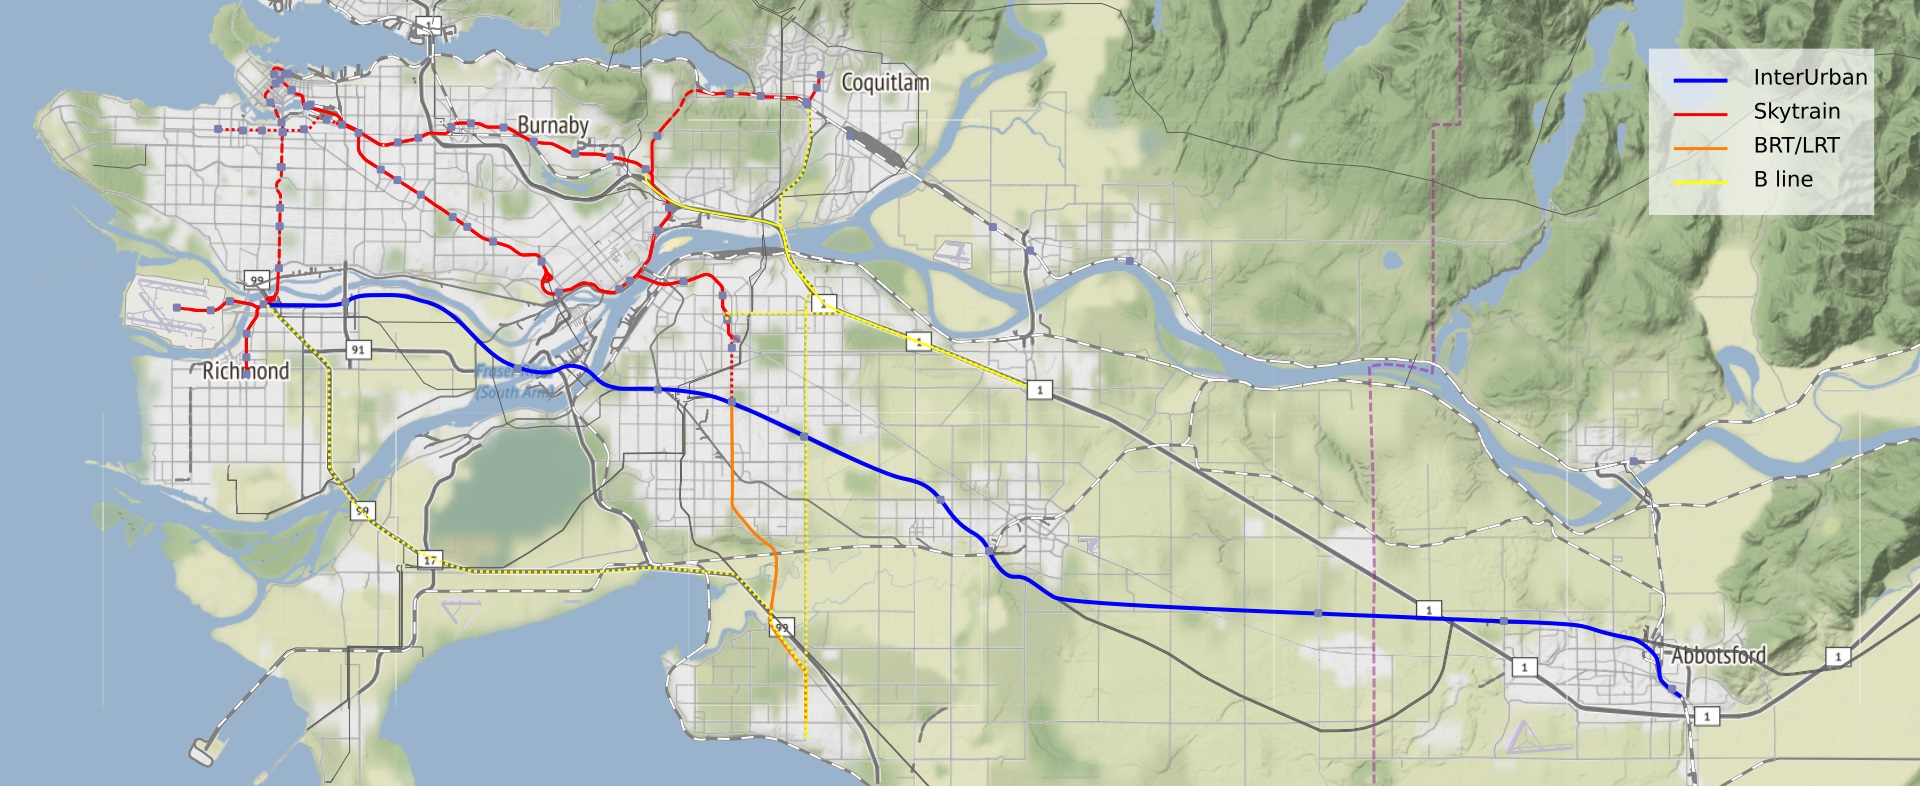
Interurban line, from Richmond Bridgeport to Abbotsford; using BC Hydro corridors on most of its length (the map highlight the BC hydro as well as existing rail corridors)
The advantage of this line is that
- it provides a fairly straight line without too short curvatures [4] and an adequate vertical profile [5]
- it requires virtually no private land acquisition
- It is completely separated from freight trains; a Transport Canada requirement to allow train built on European standard to operate on the line
The expo line then needs to be extended 3km along King George to provide a seamless transfer with the regional train[6].

Fraser crossing in the vicinity of MacAdam creek, in Delta, where the alignment takes advantage of the bluff on the south side, to reduce the approach to a bridge which clearance should be at least as high as the Alex Fraser bridge – new Panamax ship class allows an air draft of up to 58m
To preserve the future, The regional line should be built for European style standard train EMU (such as the Bombardier talent-2). That supposes to build the line to UIC standards allowing speed in excess of 160km/h, ideally 200km/h: that means in particular:
- double track platform width of ~13m
- no level crossing
Estimated travel time (in mn) between key stations with an express train calling only at the below mentioned station [19]
| Abbotsford | Langley | Surrey | Queensborough | Richmond | |
| Abbotsford | 15 | 24 | 31 | 42 | |
| Langley | 15 | 9 | 16 | 27 | |
| Surrey | 24 | 9 | 7 | 18 | |
| Queensborough | 31 | 16 | 7 | 11 | |
| Richmond | 42 | 27 | 18 | 11 |


cross section of the track platform for the Lyon-Marseille High speed line ( 350km/h max speed) - source (2); 500kv double circuit tubular tower able to to replace a lattice tower if the tower foot print is an issue - source (15)
Numbers suggest such a line could be built at cad$35M/km [7] putting the total cost of the regional line at $2.5Billions (remember that the Brunette interchange alone costs $0.5B). However, the line doesn’t need to be built in one shot, and can be phased, a first phase consisting of the 12km Langley-Surrey section, estimated then at ~$500M.
For this short first section, a tram-train, able to reach 100km/h and to ride the Langley streets could be considered at first [8]. Since it could benefit of a totally segregated infrastructure (in trench) between Langley and Surrey, a 12 mn travel time could be easily reach. (A Translink study [1] suggests such travel time could attract up to 6,000 pphpd in 2041, what is the relevance zone for such a transportation mode)
Cost and benefit
The skytrain extension has been costed at $85M/km (2010)[1] in viaduct and $140/km (2010)underground [11] (all including stations), so that the total cost of the project in its first phase could be keep in the $1B envelope, and still include a BRT lines Surrey 88th-Whiterock, as well as some B line connecting Guilford not only to Surrey central but also to the interurban and Coquitlam.
The closest studied option by Translink was the option titled RRT 1A (skytrain extended to Langley and BRT on KGH and 104th)[1]: our proposed option in its first phase is slightly less appealing on the Langley Surrey section (doens’t go directly to Surrey center, and doesn’t eliminate the skytrain transfer). On the other hand, it still provides similar travel time, between the 2 cities (and Vancouver), and a tram-train option allow a finer coverage of Langley downtown. Subsequent extensions make our proposal of better value.
A Skytrain to Langley , means, the train could run well below capacity (or at very spare frequency, what is not without issues). an extension collecting both the traffic flow coming from the King George corridor, and Langley could make better use of the skytrain capacity
Our proposal makes also a better use of the skytrain capacity (the extension collect ridership from both the Langley Regional train and the KGH BRT). Our proposal offers a shorter BRT route on the KGH branch (due to the skytrain expansion here), and equal on the 104th branch: We can consider our proposal carries all the benefit of the RRT 1A option, at half of the price tag. In any case, it is a much better solution than the one currently imposed by the Mayors’council, which will not benefit to Langley and will be detrimental to White Rock by introducing an additional transfer with no travel time benefit, and which cost has already escalated to a whopping $100M/km
[1] Surrey Rapid transit Alternatives Analysis – Phase 2 Evaluation, Translink, 2012.
[2] V. Profillidis, Railway Management and Engineering: Fourth Edition, Routeledge 2016
[3] In addition to the operating constraint imposed by the freight trains, Transport canada requirement for passenger train mixing with freight train make such solution a non starter beside commuter train such as the West coast express)
[4] The curvature suggests speed limit of 160 to 200km/h speed between Langley and Surrey, 160km/h around the Nordel Mac Adam Creek section (thought requiring some expropriation), 120-140Km/h, in the approach south of Langley…that is assuming a typically a minimum curve of 1250m for 160km/h; some figure also roughly and intrinsically adopted for the californian HST [10]
[5] French high speed rail tracks have gradient of up to 35/100, and 40/1000 on the german Koln Rhein [2].
[6] In the proposed scheme, the track along King George Highway could be branched before the eponymous station. The later could be retired, and
a new one built.
[7] French high speed line, built on higher standard, are typically build at a cost of cad$35M/km or €22M/km (10% for land acquisition, 65% for civil engineering, and 25% for rail, power and signalling)[16]. However the Fraser crossing could require a specific estimate
[8] Such choice, should not hinder the capacity of the line to run faster train. If electric, the tram-train should then be dual voltage, the main line, equipped with standard 25kv AC60Hz, the street extension in 750V. Similarly the stations should be designed to allow a layered service with tram train calling at local stations, while faster train could call only at main stations.
[9] The skytrain vehicles (and consists) are designed to maximize the throughout of the line, so seating is minimized, and comfort of it is not a priority. The driverless technology allow very high frequency at marginal cost, but it imposes also high “minimal operation” cost, to both maintain and operate the line, making this technology not a prime choice in the current condition.
[10] California High-Speed Train Project : Technical Memorandum, Alignment Design Standards for High-Speed Train Operation TM 2.1.2; California High-Speed Rail Authority, 2009
[11] UBC Line rapid transit study: Phase 2 Evaluation report Steer Davies Gleave, August 2012
[12] South Fraser Strategic area transit plan, Transportation and safety committee, City of White Rock, August 22, 2006
[13] This tends to be a typical requirement for new regional transit lines in european conurbation. As an example the new subway line planned in Paris area are targetted to have a commercial speed of 55 to 65km/h.
[14] It is interesting to notice that the LRT line in Surrey is costed higher than a french High speed line, the later arguably incurring more extended civil engineering work: it is possibly due to the fact that Surrey LRT construction cost include the relocation of the underground utilities, and the construction method must include important traffic mitigation.
[15] Proponent’s environmental Assessment: Tehachapi Renewable Transmission Project, Southern California Edison, 2009, Figure 3.2.4.
[16] La grande vitesse ferroviaire : un modèle porté au-delà de sa pertinence, Cour Des Comptes, Republique francaise, 2014
[17] the track renewal cost can be estimated at Cad$5M/km, including electrification, for a single track, and work progress can be as fast as 600m of track renewal/day, this from a similr work done to establish a tram-train in the vicinity of Nantes. This number is in line with the provided by a Leewood report[20] for the Rail for the Valley organization
[18] Camille Saïsset, Tram-train Nantes-Châteaubriant, une liaison efficace pour la réouverture de voies, Actu-Environnement, July 27, 2012.
[19] the numbers assume a average speed line of 140km/h, an average acceleration of 1m/s/s, and a dwelling time of 2.5mn. The 24 mn travel time between Surrey and ABbotsford, can be compared to the 44mn travel time given by [20] between Abbotsford and Surrey Newton using the BCER or the Google estimated 35mn road travel time between Abbotsford (Highway 1#11) and Surrey Central (with clear traffic)
[20] Lower Fraser Valley British Columbia, Chilliwack to Surrey Interurban, proposal fro rail for the Valley, David Cockle, Leewood Project, 2010.
Arbutus corridor and accessibility: a straw man argument?
August 9, 2016
the debate is framed like it: to be against a blacktop path is to be against accessibility.
Accessibility for all activities or all abilities?

It is no secret that the debate is mainly geared by the Vancouver cycling community, and the main local organization, HUB, has made clear its vision; a cycling highway -where one can “bike from the Fraser River to False Creek in 30mn” (that makes an average speed of 20km/h+) [1]. From there, the conversation regarding accessibility is mainly reduced to wheelchair accessibility concerns, while at the same time accessibility is understood as skate board and roller skate users inclusion.
However, if we understand accessibility as “universal access” for people with impairment of various nature, the conversation take another turn: A trail where a cyclist can zip at 25km/h becomes quickly unfriendly to people with a visual impairment [2]. The accessibility problem is multidimensional and can’t be reduced by how comfortable it is for the small wheels.
A cycling corridor or a greenway Promenade/trail
Emphasis on cycling speed, as Hub is advocating for, is in full contradiction with the concept of Promenade as inferred by a Greenway designation [3]. We can consider 2 main family of promenades:
- Scenic promenades; and
- Experential promenades
The Vancouver Seawall is a great example of scenic promenade: the emphasis and the purpose of the promenade are the views it can offer. The west Richmond dykes falls also in this category. other trails could not offer too much of a view but a more experiential aspect: the Stanley park inner trails fall in this category, as well as the Richmond Shell road trail or the Lynn valley trails (including its suspended bridge).
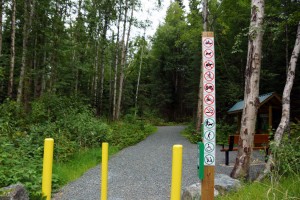
If the focus of a trail is a viewpoint, one would like then provide the easiest access to it, if the focus of a trail is experiential, then one would like provide the best compromise comfort/experience. That is the trail itself, and noticeably its surface shouldn’t distract of the experience, which sensorial aspect must not be neglected. A universal accessibility trail exists in Stanley park, it is Beaver lake trail [6]:

Stanley park: Beaver lake trail entrance
Similar trails exist elsewhere in the region, Fitzsimmons trail in Whistler, the Panorama trail at the top of the Squamish SeatoSky Gondola or the Spirea nature trail in the Golden Ears park are among them. However some other trails, though not designed universally accessible could in fact be much more wheelchair friendly that the Stanley park’s Beaver trail (which has not keep up with the up to date standards): it is at least the case of most of the Burnaby Central park trails:


The wide and flat enough trails of the Burnaby central park offer good rolling condition, and stay in good condition during raining periods as illustrated in this Google view.
The Stanley park trails accessibility could not be up to the current standards:
What about the state of the art?
In BC, the very recently opened Great West Life trail in Prince George is pretty much the state of art:

The Great West Life Trail of Prince George
A hard packed surface, soft enough for the knees of the elder, and still presenting good rolling capability, as well as other surface treatments, such has woodboards, provide a rich experience [4]. It features wheel-guard where required and slope not greater than 3%. Such a trail design is the result of a cooperation with the Spinal Cord Injury-BC society.
Trail head accessibility?
It is another aspect where the Burnaby central park is hard to beat: it is directly serviced by the Skytrain (Patterson station) as well as 2 frequent transit bus routes (19 and 49). Something Stanley park can’t compete with.
What about the bikes on an universally accessible trail?
The state of the art doesn’t seem to have found a compromise much better than this:
The all ability accessible GWL trail in Prince George is not allowed to bike
The banning of bike from Universal accessible trail, seems to be common [5] for reasons previously touched. Cycling is in theory also not allowed on the “universal accessiblity” trails of Stanley park , but the rule is not well respected.
A preliminary conclusion
Our region is surrounded by trails often offering first class experience, but when time comes to find an accessible trail, the region becomes a laggard. When it is time to find an “universally accessible trail” reachable by public transit: pretty much nothing exists.
it is where the Arbutus corridor becomes a golden opportunity: it presents many characteristic required for an “universally accessible trail”, first of them, being the gentle grade, second being the experiential aspect- including the sensorial aspect capitalizing on the meandering among community gardens. third it is easily reachable by many frequent transit routes, allowing to experience it in many different ways.
It is also clear that an “universally accessible trail” vision capitalizing on the experiential aspect of a greenway is not compatible with the cycle track vision as exposed by Hub, and a compromise will need to be found.
[1] Arbutus Greenway Announced, Hub news, March 14, 2016
[2] Similarly, Accomodating visual impaired people is also the main challenge the designer of shared space has to address
[3] A reason why a cycle track on the Paris Petite Ceinture (a disused rail corridor) has been dismissed, as we have seen in a previous post
.
[4] It is also good at maintaining the motor skills and enhance the mental health, a reason why such surfacing are often preferred.
[5] It is also the case for the promenade built on the Paris Petite Ceinture, among others.
[6] The ravine trail is also presented as “universal accessible” by the Vancouver park board, thought it has some questionable access impediment.
Arbutus corridor: the destruction of a greenway
August 8, 2016
This Vancouver rail corridor used to be double tracked, and saw passenger service from 1902 to 1954. The last commercial train has been seen in 2001. The asset has been considered very early for a North South rail transit line: A more direct alignment via Cambie, has been preferred for the Canada line circa 2006. That was closing a chapter…However the track was still there, and the hope of a local tram has always stay alive in some circles: the 2010 Olympic line demonstration was giving reason for hope…and CP rail was wanting to bank on its precious real estate. After a bit of bullying by CP rail, in order to get a fair price, the city agreed to purchase the corridor for $55M in March 2016, openinga ew chapter:
The Arbutus corridor was a defacto Greenway:

The Arbutus corridor circa 2014 (credit photo CityHallWatch)
Like many disused railway corridors, a greenway was a logical option for a corridor presenting some natural qualities. However where usually the authorities capitalize on the specificity of such assets, the city of Vancouver has decided to destroy it: A destruction in 2 steps [3]:
Destroying the memory of the place

The Arbutus corridor circa 2009 (credit photo Stephen Waddell)
It has been vague promises of reusing the corridor for a rail transit by the City, but this quickly vansihed, and instead to see a preservation of what make this corridor apart and a reminder of its potential alternative uses, it quickly appeared that the city had negociated the removal of all things related to the railway. That is certainly one of the safest mean to kill any prospect of reactivation of this corridor as a future rail transit corridor (1), it is also a a first blunt to the soul of the place.
Destroying the feel of the place
Many disused urban railway corridors exhale a specific atmosphere found nowhere else in a city, which people growth to appreciate and like it. It was also the case for the Arbutus corridor, something Patrick Condon has worded as “People have gotten quite used to the Arbutus Corridor as kind of a romantic landscape — the kind of unkempt quality of it. it’s level of decay has become something that people kind of like…” [4], what reflects pretty much the position of the current Paris city council, especially as expressed by Christophe Najdovski, the councilor in charge of transportation and public space of Paris, who want to preserve “the mystery and magic” of the Petite ceinture, a disused railway in Paris [6].
Beyond Paris, many other cities capitalize on the experiental side of their assets, that is the case for the Shell road trail in Richmond as stated by the city website:
“The Shell Road Trail is long interior trail that runs north/south along the Shell Road corridor from Alderbridge Way to Williams Road. This interior trail has a distinctly rural feel to it with tall trees and shrubs lining both sides of it, making it a unique trail experience in an urban City Centre.”
The Richmond Shell road trail, and the Colombes “voie verte” (greenway) illustrated below:


The Vancouver official development plan for Arbutus was also not far of this vision, since it was designating it as a greenways, including without limitation [2]:
- (i) pedestrian paths, including without limitation urban walks, environmental demonstration
trails, heritage walks and nature trails; and - (ii) cyclist paths.
The challenge for the designer of such places is to preserve their specificities and feels, while making them accessible to people of all ages and abilities… In the name of the later, Vancouver has simply destroyed the former:

A 4 meter wide bike path under construction? – credit photo [5]
Under public outrage, the city has potentially recognized the insentivity of its position and halted work…temporarily…
Does other solutions were possible?
Yes and it is not even too late to apply them, but what is almost sure is that the corridor has already lost its cachet: whatever final design will be – and it could be a nice one – it is poised to be more bland and artificial since it will be build of a blank state. The soul of the place is lost and, and it is not something designers are armed to restore. The end result is that the whole city will be poorer in diveristy of experience
The main issue now is the treatment of the surface path: it is the object of another post
[1] It is one of the reason why Paris took the complete opposite step for the Petite Ceinture, as we have seen in a previous post
[2] Arbutus Corridor Official Development Plan (Adopted by By-law No. 8249, July 25, 2000), city of Vancouver
[3] The destruction of the greenway is documented on the Stephen Rees blog, here and there
[4] Arbutus’ asphalt greenway not paved with good intentions, critics say, Matt Robinson, VancouverSUn, August 3 2016, Vancouver
[5] City paves way for Arbutus Greenway, Naoibh O’Connor, Vancourier, August 2, 2016, Vancouver
[6] Petite ceinture : faire le tour de Paris à vélo et autres fantasmes, rue89, September 25th, 2013
The Paris petite ceinture in 2 city hall elections
August 5, 2016


The Paris petite ceinture is a railway ringing Paris, built between 1852 and 1869. It was once well used, before falling in state of abandonment. The last commercial train has been seen in the early 1990, since then questions on how the corridor should be re-use have recurringly arised
2001: The return of the Parisian tramway.
The early 1990, mark the renaissance of the tramway in Europe, and especially in France (5), and quickly enough , many advocates promote the idea of reusing the petite Ceinture to the benefit of such a transportation mode in Paris.
There is effectively a market for this. The parallel transit lines (bus PC on the adjacent Boulevards, called Boulevard des Marechaux, as well as the circular subway line 6. A 1995 study suggests that the line could attract 17,000 passenger per hour for this line once transformed as a surface subway (equivalent to the S-bahn) running at 30km/h…In the meantime an alternative option under study (1) is to upgrade the adjacent bus route into a tramway line with a much lower average speed, 20km/h, and per consequent a lower expected ridership 7,700 to 9,100 passenger per hour, but the later option also provides better connection with the existing subway network, as well as better local service.
The 1995-2006 city council under the right wing mayor JEan Tiberi was leaning toward this latest option, which had the advantage to not introduce new nuisance in a corridor which has became almost a natural reserve , but preferred to delay any hard decisions…so that the reintroduction of the Parisian tramway will be a contentious point of the 2001 municipal election.
The challenger and then long time councilor Betrand Delanoë, and its team had a very clear and articulated position on the tramway, as expressed by its then Transport commissioner, Denis Baupin (Green party):
“ it marks a symbolic stop to a politic favoring the car, […], beside it, its main asset is the requalification of the urban space (5)” (2)
Delanoë is elected in 2001 and the work on the tramway will commence almost immediatly, to get inaugurated in 2006:

Delanoë will be reelected for a second mayoral mandate in 2007, but the question of the use of the petite ceinture has been left open: if not a tram, what use?
2012: The cycling highway idea
Delanoë, is then not seeking a third mandate, and endorse his first Adjoint, Anne Hidalgo. Hidalgo main contender is Nathalie Kosciusko-Morizet (nicknamed NKM) coming from the conservative party. The time when the introduction of a bike infrastructure in the city was contentious is already a distant memory in 2012, and the cursor has moved on what kind of cycling infrastructure is the best? NKM proposes to reuse the Petite ceinture platform to implement a supercyle highway ringing Paris.
The idea will be quickly shut down by her main opposants: (3)
It has a geometry disadvantage of not being at grade (either tunnel or viaduct), and offering very few connections with the existing street network, but the main arguments against it are philosophical in nature:
- It creates usage conflict: a cycling highway with bike riding at 20-25km/h is judged not compatible with other use such as purposeless wandering or flanerie
- It goes against the specify of the place, which exhale an unique unkempt atmosphere, slow speed local has grown to appreciate: “timeless”, “uniquely silent”, “mysterious and magic” are common thematic associated with the Petite Ceinture.
- At the end, if one wants to really make the choice of active transportation, this needs to be done at the expense of other transportation mode.
Anne Hidalgo has been elected, and staged progress on the petite ceinture are occurring with the above in mind but with an important constraint: The transportation corridor (still property of the SNCF), need to keep its conversion potential to its former glory, whether the need arises in the future. A design reflecting this constraint supposes to provide a constant reminder to the user of the space of its original usage and potential future one:
It is what is achieved below, with a space accessible to people of all age and ability (4):


(1)it was in fact 2 competitive studies, the Petite ceinture option promoted by the french national railway network (SNCF), owner of the infrastructure, and the Boulevard des Marechaux option, promoted by the Parisian transit operator, RATP.
(2) Face aux lobbies, le tram trace sa voie. Petite ceinture ou Maréchaux, Paris retrouvera le tramway au XXIe siècle, Liberation, April 17th, 1996
(3) Petite ceinture : faire le tour de Paris à vélo et autres fantasmes, rue89, September 25th, 2013
(4) credit for all below pictures to Architecture Urbanisme FR
(5) See our post Transit as part of the urban fabric, October 23, 2012.
Below, some comments shared with the Vancouver city planners on the Joyce -Collingwood precinct review:
Heritage houses

An 100 year old house on Spencer street
There is a couple of 100 years old houses presenting some interesting heritage features in the neighborhood subject to rezoning: some strategy to preserve them should be in place so that the rezoning is not obliterating the history of the neighborhood.
The towers

Rezoning proposal as seen from Tyne#Kingsway
The height in meter make more sense than the height in storey, since the building form is what matters (In this context the tower floor plate size are important, but the lack of FSR limit for the tower site is a non issue).
The planner are aligning the tower geodesic height on the one of the nearby telus building (similar strategy occured for the construction of the Wall centre at Central Park)…an altrnative view could have been to set up some view cone, more namely from the Richmond dyke:

The telus and Wall centre tower are well visible from the Richmond ALR (near dyke on the Fraser North arm): having those tower kept below the tree line, could have preserved the rural nature of this location
The townhouses
The open house posters suggested 2 rows of townhouses: This eventually needs to be clarified, especially in term of set back (and parking). If in the long term that can transform the alleys into “real street”: it seems to be good, and that should be the intend. Unfortunately, this doesn’t seem the case.

Narrow street in Groningen (a natural evolution of laneway) – credit photo pricetags
Vanness street (West of Joyce)
The plan call for 6 storeys all along Vanness Street. The current “redeveloped” building are at 4 storey max, but in fact 3 1/2 Storey along Vanness due to the topography. This could also need to be clarified for the new construction.
The plan seem to provide generous margins for the buildings. Ideally, the skytrain guideway should have provided a refrence for the building height.
The BC parkway (and skytrain viaduct) has carved the land here, so that the tree line keeps horizontal instead to follow the slope: , while construction follow the slope of the hill around, This specificity is not a big deal as long as the constructions are lower than the tree line. It becomes an issue otherwise: the Skytrain guideway is at level 3 of a building at Rupert, but as at level one of a building at Spencer: This is making a mid- rise building looking much taller at Spencer than at Rupert.
One could also consider that the rezoning for properties West of Spencer, should be considered in the wider context of the desired street-scape for Rupert
Wellington (East of Joyce)
At the difference of Vanness, the topography works for a more aggressive densification than proposed:
The properties at the SE corner of Payne#Wellington are proposed for 4 storeys, but 6 storeys building could work better (would not be much higher that the westward building along Wellington proposed at 6 storeys, as illustrated below


Visual impact of a 6 storey building aon the SE corner of Payne and Wellington: view from Wellington looking East, then West
McHardy street
Provisions should be made to ensure that buildings offer engaging facade on it:
That will help this street to reconnect the north and south side of the neighbourhood.
It is a street without sidewalk (but very poor pavement act as a traffic calming measure, and so the street doesn’t work that bad): Installing sidewalk is not necessarily the best solution. Treating this street as a shared space could eventually provide a better outcome:

A shared street concept could be a preferrable design for Mac Hardy.
Joyce street
All the rezoning should be conditional to the closure of the lanes immediatly north of the Skytrain guideway. A bike/Pedestrian “passageway” or “commercial gallery” should be opened, to connect Yardley Avenue to Joyce street on the West.

Joyce street looking South from Wellington (shadow ~5pm on June 21st)
Joyce street can be an interesting street, if the street wall provide some rhyme. However the idea to have tree planted in the middle of it is not compatible with it:
- It prevent the light to penetrate the street
- It hinder the perspective
- And the street right of way is not that wide (80ft): space dedicated to pedestrians movement should be maximized, median divider and left-turn lane should be removed.
trees on the side are welcome, but the cultivars need to be chosen to provide mature tree tall enough (such as London plane) to match the scale of the street wall: In short, the whole Joyce street-scape needs to be reviewed, and due to the significance of this street as a gateway for the neighborood: this could need to be part of a specify consultatio
A couple of thoughs on this rezoning process.
The Rational.
In 2014, the city decided “the neighborood didn’t developed as expected: let’s do something about it”. The city never admitted that the whole process was triggered by Westbank wanting to build a 30+ storey building at 5050 Joyce street [4]. (Instead, it rationalized it on the TransLink’s planned upgrade of the Joyce-Collingwood Skytrain Station [5] , as an opportunity to review its zoning policy)…and still… it was the right think to do (and there is no harm to admit it!)
- don’t consider the Westbank application for spot rezoning, but don’t reject it outright either – rather contextualize it in an community plan.
Considering that the previous Joyce-Collingwood Station Area Plan dated back 1987, and considering that effectively, beside the Collingwood village, which has became a posterchild for successful Transit Oriented Development [6], no much has happened elsewhere- some update was necessary.
The apriori limited area concerned by the rezoning makes also relatively good sense:
- In the context of the Westbank application, you don’t necessarily want to have a community plan taking years to take shape
- The transit station precinct specificity is in fine recognized by the perimeter of the rezoning, and this eventually allows to reach a quicker form of consensus (It is a natural density node) [7].
The city engagement processus.
- A walk and “round table” was organised in December 2014, from there a diagnostic was “done”, which leaded to a first report
- A workshop was organized on June 20, 2015 in 2 different sessions ( land use and building form, in one session and transportation in another one)
In this well attented workshop, the participants suggested different building typology for differents areas:


I have attended it, and in my recollection, the exercise turned out to be fairly consensual: the Marine drive development was seen by many as a good way to illustrates the desirable building form (and scale) for the Joyce station immediate vicinity, with transition zone formed by mid-rise and townhouse stitching it with the predominant Single family house area. The Transportation workshop was relatively uneventful. After an “open house” held in July 2015, where the city staff presented its recollection of the above, the Vancouver planners proposed 3 differents zoning options (the difference residing essentially in the heigh of the high rise immediatly adjacent to Joyce Station). on October 20, 2015. Below is an illustration of the most ambitious proposal (highest tower):


Up to October 20, the things was rolling out surpinsigly smoothly. However, on october 20, at the location the city staff was unveiling its rezoning proposals, it was also an unadvertised “open house” hosted by Westbank to present its formal 5050 Joyce street application. That was unfortunate enough and proven to be a turning point:
Quickly enough, some people “organizing on the ancestral, traditional, and unceded territories of the Musqueam, Squamish, and Tsleil-Waututh peoples” launched a curiously worded petition and a new organisation popped-up Jara, with very certainly many well intentioned activists. Beside their concerns on “affordable housing”, it has always been hard to understand their ultimate motivations (their last post doesn’t help either), leading them to adopt a rather confrontational approach with the city consultation efforts .
It is possible the people at Jara was not aware of the early stage of the consultation process: The city didn’t seem to have put lot of effort at reaching the neighborood [1], something Jara has been kind to correct. Jara has been pretty active at engaging the local citizens, and look to have engaged in some efforts overlapping the city’s organised workshop, and has produced its own report, however it seems to not have helped to dispell some misconceptions such as “rezoning = expropriation“
That eventually leaded to another apriori more controversial open house on April 6, 2016:
The tension was quickly diffused by breaking the attendance in small group, preventing a town hall meeting showdow: the attendance turned out to have more questions that recriminations. However, where the attendance seems to agree is on the question of the benefits occuring from rezoning:
The neighborhood has accepted very significant densification. The Wall centre at Central park, has generated ~$12M in CAC + DCC, this in addition of the CNH annex and Mosaic space [2], from which apparently not a single cent has yet been spent in the neighborhood [9]… So it is certainly possible the neighborhood feels short changed on the topic. Explaining that the neigborly community centers, such as Killarney, a 30mn walk away, can serve Joyce Collingwood is probably unsatisfactory. It is not that the question of community amenities is new [2], but the expectation is to have those amenities such as swimming pool or ice rink, or even public libraries coming right in the neighborood accepting very signifcant densification; an almost pre-requisite for “density well done”
The draft plan presentation and the 3d model

3d printing model isualizing the proposed rezoning change for the Joyce COllingwood neighborhood
The 3d virtual model previously presented in this post was a private initiative: it is my belief that the city should have shared its 3d model with the public (that to allowing the public to interact with it directly). The city presenting a 3d printing to illustrate the envisioned change is very welcome: It is an important tool to help the conversation…thought the model has arrived a bit late in the rezoning conversation (the city planner mentioned, the 3d model was only ready on Friday May 27, 2016), we just hope the city will make larger use of such tools (3d computer model and 3d printing) in the future.
The evil is in the details
I must admit, a final workshop to discuss the details of the plan (that is not questioning its general thrust, and densification objective which has been the object of previous workshops) could have been welcome: That will be the object of another post presenting the ideas shared with the city
The plan is scheduled to go beyond council on June 14 or 15th, 2016 – In the meantime, properties concerned by the rezoning have started to appear on MLS: the asking price is around 100% above assessed price (vs 20-30% for other properties in the neighborhood), all this “land lift” is something which will not be availbale for CAC (a direct consequence of the opacity of the city’s CAC policy, which is object of backroom deal)
[1] I have been made aware by a local mailing list relaying the Collingwood Neighborood House messages, but the city didn’t seem to have advertised the rezoning in the local flyer, the Renfrew Collingwood community news , neither at the Joyce station or other busy areas.
[2]RC Commty Initiative Sept 2012 draft
[3] this 3d model is freely accessible on the sketchup library site can be dowloaded in Google earth…and printed in 3d too…
[4] Westbank conducted an Open house on February 19, 2014 to gather feedback on its first prosoal. Westbank purchased the land for $9,930,000 in 2014 according to Colliers Canada
[5] Some observer will have noticed that the Joyce cCollingwood get a signficant upgrade in the years 2011-213 to accomodate the Compass card gate: most of it has been recently demolished, see more on the Metrobabel blog
[6] This Transit oriented DEvelopment has been the object of numerous study, as well as having attracted the attention of several blog, such as Fraseropolois.
[7] This is a striking difference with the Grandview woodland rezoning process, where the Commercial-Broadway station precinct is considered as no more than a sub-zone of the Grandview Woodland community. As such this precinct of regional interest (intersection of 2 rapid transit line) has been bogged down by local concerns which are trumping the general interest.
[8] The Jara campaign is also followed by EyeOnNorquay and more generally the rezoning is also follwoed with a critical view by CityHallwatch.
[9] Apparently the city, would like to use the CACs toward the building of a passerelle over boundary Rd: it doesn’t seem to be a request from the community and we don’t think it is a right use of the local CAC $: we will hopefully elaborate on it in a later post
Vancouver: Another day on the route 20
May 25, 2016

3 bus 20 in a row, a typical bus bunching happening on Victoria#54th
Reliability on the route 20 is a huge issue. Its lack of reliability stem essentially of its Hasting and Commercial Drive segment. Those segments are also the most detrimental to the speed of transit in this corridor. both speed and reliability are very signifcant factors affecting both the transit attractiveness and efficiency.
The average bus 20 speed is 14.36km/h [1′, but in practice most of the riders will experiment a significantly lower average speed on the route busiest section. Below is the speed map for the bus 20 on an average weekday.

bus 20 (to Downtown) speed map on a weekday as computed from [1]
The horizontal axis represents the time of the day, the vertical axis, the location on the corridor, while the color represents the speed. (see also speed map for the SB direction
[1] Translink GTFS data for weekday September 2014
On the capacity of bikeways
May 20, 2016
it has been lot of research carried out on the capacity of roads, transit or pedestrians infrastructures, with results proven empirically. Such don’t really exist for the cycle tracks, but as the success of the London’s “Super cycling highways” shown, it will become a significant matter
NACTO, in a recent publication [8], estimates the capacity of a 2 way bike lane (3 to 3.50m) at 7,500 bike/hour. This number seems to be derived of the Highway Capcity Manual citing very dusty publications [1]. this post argues that the capacity of a bikeway is more in the 1,500 cyclist/hr/lane (where a lane is 1.20m to 1.5m wide)
A short Litterature review
Most of the papers trying to estimate a bike lane’s throughput tend to rely either on mathematical models, experiments or a blend of both:

An example of experiment leaded by [2] to determinate a bike lane throughput. The experiment above has allowed [2] to conclude that the capacity of a bikelane should be in the 2,500 bike/hr range
The problem of such approaches is they are not (yet) validated by practice (…and in some case, the experiments seem to be more representative of a velodrome typology than an urban bike lane). They also tend to provide a great range of result: One literature study [3] found a capacity of 1,500-5,000 cyclists per hour and traveling speed around 12-20 km/h. Another literature study [4] found a capacity of 2,000-10,000 cyclists per hour for a 2.5 m wide cycle track. It is also important to notice that all these numbers concern an uninterrupted bike lane (e.g bike lane with no intersection).
However, [5] ( as cited by [6] ) reported that the theoretical and practical capacities of a Chinese bicycle lane are about 2000 bicycles/h/ln and 1280 bicycles/h/ln, respectively… That is also in line with an empirical result presented by [7] concerning the Denmark:
![Bike lane capacity as a function of its width, as according to [7]](https://voony.files.wordpress.com/2016/05/bikelane_capcity_.jpg?w=480&h=362)
Bike lane capacity as a function of its width, as according to [7]
How much lanes of cyclists fit in 3.5m width bikeway
[7] tend to answer to it:
If a 1.8 to 2 m wide bikeway fit 2 lanes of cyclists, any additional lane could require a 1.20m additional width (notice that the cyclists could have a tendency to ride in quincunx to increase their available lateral room). That is the reason for the suggested significant increase in capacity as soon as an unidrectional bike lane reach 3m in the graph above. (There is also some reasons to believe that a 4 meters bidirectioanl bike lane is not width enough to enable 2 lanes of cyclists in each direction in a sustainable way: see video below)
Validation of the numbers in practice
Up to recently, it was basically no opportunity to validate a bikelane model capacity in real life. China of course has wide and busy bike lanes, but they has never presented a typology directly applicable to Europe or America, be by their different geometry or by the type of vehicle: many trikes (up to recently), and nowadays those bikelane tend to be overwhelmed by sccoter (electric or not) (- 70% in Hangzhou as measured by [6]. Bikes also tend to move much more slowly). However, with the recent opening of the London cycle highway this things could change:
This video represent the cycling traffic on the London’s Blackfriars bridge: The incoming lanes presents the symptom of a bikeway reaching capacity (bike moving slowly, at speed apparently just enough to maintain balance, and the rare occasional take over use the opposite lane)
What is the effective throughput of Black friars Bridge bike lane?
Sure enough, some cycling supporters quickly raised the question while some other provided some numbers. Here are ours
- there are 37 incoming cyclists crossing a a line (represented by the bottom of the video)
- there are 24 outgoing cyclists crossing the same line
that represents an “instant” throughput of 11,000 cyclists/hour on a period of 20s, or ~3,300 cyclists/hour/ln in the busiest direction (or the equivalent of 10,000 cyclists/hour per car width lane).
First issue, Instant throughput ≠ Throughput
Traffic tends to not flow homegeneously (move in wave, aka “stop and go” traffic), and a measure on 20s can’t be directly scaled into a more generalized throughput. [7] faced with similar issues applied a correction factor based on freeway traffic observation (by comparing maximum observed traffic volumes in 15 minute intervals and maximum volumes in 10 and 20 sec intervals on freeways): this correction factor is estimated to be 0.63
The estimated maximum throughput per lane observed on the Blackfriar Bridge video above become closer to 2000bile/hr/lane. Still a sustantial number (but already significantly less than the number touted by NACTO), a number also in agreement with theorical number exposed by
[5]
Second issue, Uninterrupted bike lane throughput ≠ Interrupted bike lane Throughput
The video below better illustrates the later issue:
Wow, exactly as predicted! RT @steinsky: Nobody uses the #cyclesuperhighway because the queues are too long. pic.twitter.com/YEcPVdkzz9
— Chris Boardman (@Chris_Boardman) May 10, 2016
There are right and left turning cyclists, which fatally indhers the capacity of a bike lane…and there are signal controlled intersections (a necessity as illustrated by the difficulty of the cyclist, waiting at an intersection, to integrate itself in the main bike lane). As for motor traffic, all these tend to halve the real capacity of a typical interrupted urban bike lane vs an hypothetcal uninterrupted one. So that the real capacity we could measure here tend to be more in the ~1,000 to ~1,700 bike/hr/ln (according to if we apply a correcting factor or not). Those numbers are also in line with results from the field carried by [5] and [7]
Why all that matters?
Notice the 2 double deckers in one lane, seen in less than 30s: Could we conclude that the transit capacity of this lane is 24,000people/hour?
It matters since wrong numbers could lead to wrong decisions on the allocation of the street space, but also on the “right sizing” of a bike infrastructure.
The matter is of importance, essentially in regard of transit:
There is no question that a bike lane can achieve a very high throughput but does a 3.5 meter bike lane can carry as much as people than a tram or a BRT?
According to NACTO, a bus lane (BRT) can carry 4,000 people (8,000 if train): Those number thought slightly optimistic [9] are fairly realistic, and can be verified empirically…Here we infer that a bike lane of similar width (3 to 3.5m) can be competitive with a buslane but not a trams transit system, in term of throughput.
Furthermore we have not touched the whole notion of Level of Service: the mentioned capacity for Transit are design capacity, that is capacity allowing the transit system at its design (optimal) speed. Reaching the capacity of the bike lane as measured on the BlackFriars Bridge tend to infers a degradation of the speed for cyclists (at least by queuing at traffic light). We also didn’t touch the bike parking issue
[1] the third edition of the Highway capacity Manual suggests a capacity range of 1700-2500 bicycle/hr/ln where each lane is 3 to 4 feet. Those numbers are inferred of previous publication (“bikeway planning design and guideline” institute of traffic and transportation engineering University of California at Los Angeles 1972, “Geometric Design” by W. King, C., and Harkens, in Transportation and Traffic Engineering Handbook, Institute of Transportation Engineers, 1972). the 7,500 number touted by the NACTO correspond to the highest range of it considering that a 3.5m wide can feet 3 lanes of bike
[2] “Experimental feature of bicycle flow and its modeling” Jiang R. Hu M. , Wu Q. and Song W.
[3] “Operational Analysis of Uninterrupted Bicycle Facilities”, Allen, P., Rouphail, N., Hummer, J. E., and Milazzo, J. S. Transportation Research Record, 1636 29-36, 1998
[4] “Bicycle Traffic Flow Characteristics: Experimental Re-sults and Comparisons”, Navin, F. P. D. ITE Journal, 64 31-36, 1994
[5] “Capacity and level of service for urban bicycle path in China”, Feng Li, China MUnicpal Engineering magazine 1995, 71: 11-14
[6] “Estimating Capacity of Bicycle Path on Urban Roads in Hangzhou, China”, Zhou D., Xu, C. and Wang D. , Transportation Research Board 94th Annual Meeting, 1995.
[7] Analysis of Bicycle Traffic on One-way Bicycle Tracks of Different Width, Thomas Skallebæk Buch and Poul Greibe, Trafitec,
[8] Transit Street Design Guide, NACTO 2016
[9] The French CERTU suggest a design capacity of 3,500 for aBRT, 6,000 fro a tram. Translink considered a design capacity of 3,000 for a BRT, and 7,000 for a LRT on Broadway.
 The name "Voony" comes from the name of the author's family cat. The author is the guy in the picture. This blog revolves mainly around transportation and urban issues in the Vancouver area.